Research
Metal’s Quiet Bull Market
Rock and metal listening, reported ticket counts and three decades of scholarship on scene participation can each be examined separately. Read together, they support an inference about why demand in these genres holds its value between release cycles.
- Authors
- Published
- Updated
Contributions
- Live Index Research Desk — Data analysis
Measured data
Measured rock and metal demand, first half of 2026, by source
Rows come from different organisations using different definitions and are kept separate. Streaming rows are national listening measures; live-activity rows are Live Nation statements about its promoted events. No independent source publishes U.S. concert volume by genre.
H1 2026 unless stated · U.S. on-demand audio streams · streaming and live rows are different units and are not additive
| Measure | Value | Definition | Source type |
|---|---|---|---|
| Rock on-demand audio streams, United States | 137.2bn | Single-genre classification against 732.7bn total U.S. on-demand audio streams in the period | Independent measurement (Luminate) |
| Rock share of total U.S. on-demand audio streaming | 18.7% | 137.2bn of 732.7bn; calculated by Live Index from the published totals | Derived from independent measurement |
| Deep catalog share of U.S. rock consumption | 75% | Recordings more than two years old as a share of rock consumption; up about 5 percentage points year on year | Independent measurement (Luminate)The highest deep-catalog concentration among the largest genres, and the reason the touring base skews to established acts. |
| Hard rock and heavy-metal live activity growth | +14% | Change in one promoter's own activity; period defined by the company announcement | Company-reported (Live Nation) |
| Hard rock and heavy-metal share of arena/stadium shows | ~13% | Share of one promoter's arena and stadium shows | Company-reported (Live Nation) |
Measured data
Selected metal and hard-rock live-demand cases, 2024–2026
Trade-reported attendance and gross figures for individual acts, drawn from Pollstar reporting. Venue classes, territories, reporting windows and reporting methods differ by row. The rows are selected examples, not a statistical sample: they are evidence that demand exists at each scale shown, and they do not establish a genre-wide trend, because no independent census of concert volume by genre is published.
Tickets and gross as reported · single shows, tour segments and career totals appear in the same table and are labelled accordingly · rows are not additive and not comparable
| Act | Event or tour | Venue class | Tickets | Gross | Source |
|---|---|---|---|---|---|
| Sleep Token | 2025 North American arena run, 17 U.S. shows (per-show average) | Arena | 12,117 avg. | ≈$1.4m avg. | Pollstar, October 2025Barclays Center, Brooklyn: 12,561 tickets and $1.79m for a single date. |
| System of a Down | 2025 Latin American stadium tour (tour segment total) | Stadium | >500,000 | Not reported | Pollstar, September 2025Includes 70,000 at Autódromo de Interlagos and 100,000 across two nights at Allianz Parque, São Paulo. A six-date North American stadium run in 2025 sold out. |
| Deftones and System of a Down | Golden Gate Park, San Francisco, 2024 (single event) | Outdoor festival-scale | 50,186 | $9.6m | Pollstar, March 2025 |
| Metallica | M72 World Tour, 49 stadium concerts to May 2025 (tour total) | Stadium | >2,900,000 | >$340m | Pollstar, May 2025Sample within the same total: 137,620 tickets and $15.2m across three Syracuse and Toronto shows. |
| Ghost | Skeletour, to September 2025 (tour total) | Arena | ≈500,000 | Not reported | Pollstar, September 2025Madison Square Garden sold out at 12,527 tickets and $1,385,794, alongside a sold-out European run and multiple arena dates in the 10,000–14,000 range. |
| BABYMETAL | 2025 The Theater at Madison Square Garden (single show) | Theatre | 4,619 | $334,694 | Pollstar, July 2025The same year the act sold out The O2 in London at 15,000, a venue-class difference of roughly three times inside one touring year. |
| Slayer | Pollstar career box-office database, headline shows (career total) | Mixed | >1,700,000 | $89.5m | Pollstar, August 2025A career aggregate spanning decades of reporting, included to show the depth of the base rather than current-year demand. |
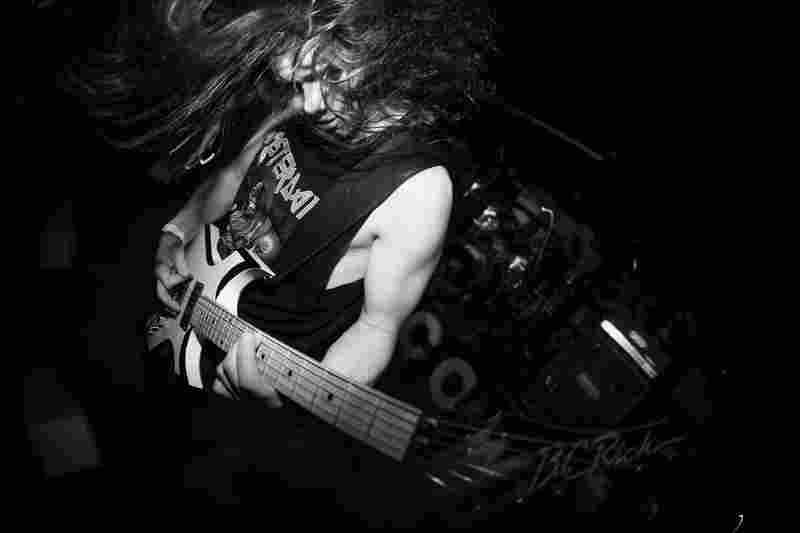
Rock listening in the United States expanded from 234.22 billion on-demand audio streams in 2024 to 260.5 billion in 2025, according to Luminate figures reported by the Associated Press.1 In the first half of 2026 Luminate recorded 137.2 billion U.S. on-demand audio streams for rock against 732.7 billion across all genres, about 18.7 percent of national listening volume and the second-largest single-genre total in the country.1 Over the same period Pollstar reported arena and stadium ticket counts for hard-rock and metal acts that would be treated as significant news in any genre with a larger press corps: a Metallica stadium tour past 2.9 million tickets, a System of a Down stadium run past half a million tickets in Latin America alone, a Ghost tour approaching half a million, and a Sleep Token arena tour averaging more than 12,000 tickets a night.781012
This piece keeps three kinds of statement apart, and the distinction is doing real work. Measured facts are counts published by organisations that collect them: Luminate's streaming volumes, Pollstar's reported attendance and grosses, Live Nation's statements about its own promoted events. Scholarly findings are the results of ethnographic and survey research into how metal audiences behave, produced over roughly forty years by sociologists and cultural researchers who did fieldwork in the scenes they describe. Inference is what remains: a reading of why the counts hold up, which the counts themselves cannot prove.
The Numbers Behind the Noise
Deep catalog, meaning recordings more than two years old, accounted for roughly 75 percent of U.S. rock consumption in the first half of 2026, up about five percentage points year on year and the highest concentration among the largest genres.2 Most rock listening is repeat listening to work the audience already knows. Luminate's 2025 fan-growth analysis adds behavioural texture to the same population: hard-rock listeners skew male and Millennial, are 138 percent more likely than the average listener to discover music through video games, and are 150 percent more likely to listen on vinyl.5 Discovery through gameplay and consumption on a physical format are both slower and more deliberate than a playlist add, and both leave a durable object or context behind.
On the live side, Live Nation reported a 14 percent increase in hard-rock and heavy-metal activity and said the genres accounted for approximately 13 percent of its arena and stadium shows.3 That figure describes one promoter's events, inside a business that reported roughly 55,000 promoted events and approximately 159 million fans in its 2025 fiscal year.6 Pollstar's reporting is different again: box-office submissions for individual shows and tours, act by act, with no genre census behind them. Three organisations, three collection methods, three definitions of the category. The accompanying tables keep the rows separate for that reason, and neither table produces a total.
The Audience Was Here Before the Charts
The framing of a metal revival misreads the sequence. Deena Weinstein's study of the genre and its culture, first published in 1991 and revised since, documented a fully formed audience with its own institutions, media, dress codes and codes of conduct at a point when the mainstream music press had largely written the genre off.19 The change since then is best described as a change in the measurement apparatus; the audience described in that fieldwork was already there, uncounted. Streaming produced the first continuous national count of what people actually listen to, and it turned out that a lot of them listen to rock and metal, repeatedly, for years after release. Box-office reporting produced comparable per-show counts, and it turned out that acts with modest radio and editorial presence fill arenas.
Two features of the genre made it invisible to the older apparatus. Metal's commercial life ran through album sales, physical merchandise, specialist press and touring, none of which generated the kind of weekly national number that shapes coverage. And the scene's own self-definition rewarded distance from mainstream visibility; Keith Kahn-Harris's fieldwork in extreme metal describes a global network sustained through tape trading, fanzines, small labels and later the internet, with participants maintaining a scene that had almost no relationship to mass media exposure.20 An audience organised that way does not appear in the charts that industry attention follows, which is a measurement problem rather than an audience problem.
Catalog Never Dies
In most genres a catalog share as high as rock's would be read as decline: an audience ageing with its records, with no new entrants. The live numbers make that reading harder to sustain here. Rock's 75 percent deep-catalog share sits alongside a rising absolute stream count, which means the older material is being consumed more, in a category that is also growing.12 For a touring business, a large and repeatedly consumed catalog is a specific asset. It means the setlist has value independent of the release cycle, that a tour does not depend on a current single to sell, and that an act can return to the same market every two or three years against the same body of work.
Metallica's M72 tour is the clearest expression of that structure. Pollstar reported more than $340 million grossed and more than 2.9 million tickets across 49 stadium concerts by May 2025, with a three-show Syracuse and Toronto sample accounting for 137,620 tickets and $15.2 million.10 The tour's no-repeat-weekend format sells two different nights in the same city to an audience assumed to be buying both, which is a commercial bet on catalog depth rather than on a new record. The band extended the same logic into a 2026 Las Vegas Sphere residency, a format that converts the catalog into a fixed-location product and moves the travel cost onto the audience.11
Deep catalog also caps something. An audience returning to known work is an audience with strong preferences about what a show should contain, which constrains how much an act can change and still sell. The same asset that makes demand predictable makes it conservative, and the two effects are not separable in the published data.
The Scene Comes With the Ticket
Scholarship on metal audiences has converged, from several methods, on a description of participation rather than consumption. Snell and Hodgetts, working in New Zealand, analysed a metal scene as a community of practice in which identity is negotiated through shared activity: knowing the music, holding a position on it, behaving correctly in the venue, being recognised by others who do the same.22 Susanna Larsson's study of Swedish metal fans, titled from the phrase 'I bang my head, therefore I am', documents how embodied practice and everyday listening carry identity claims that participants articulate explicitly.21 The membership these studies describe is earned and maintained through activity, and it decays when the activity stops.
None of this scholarship measures ticket sales, and none of it was designed to. Its relevance to the live business is inferential, and the inference is worth stating precisely. If participation is maintained through activity, and attending shows is one of the central activities, then a portion of concert attendance in these genres is doing identity work that a streaming subscription cannot do. Demand of that kind should be less responsive to whether an act has a current release, and more responsive to whether the scene is active in a given city. The published counts are consistent with that reading. They do not demonstrate it, because no dataset links individual fans' scene participation to their ticket purchases.
The word tribal gets used loosely about metal audiences, and it flattens what the research actually found. Metal scenes differ sharply by subgenre, geography, gender, class, ethnicity and ideology. Kahn-Harris's work on extreme metal is substantially concerned with internal conflict, including over racist and far-right currents in parts of the scene and the boundary work involved in contesting them.20 Death metal, power metal, black metal, metalcore, doom and nu metal maintain distinct aesthetics and distinct audiences, and the crowd at a Ghost arena show overlaps only partially with the crowd at a small black-metal bill in the same city on the same night. Treating any of this as a single tribe with one set of preferences produces bad routing decisions and worse pricing ones.
The Pit Has a Physics
The concert floor is where the practices these studies describe become physical, and it is also where the genre's economics get their unusual shape. A pit is a self-organising crowd formation with its own conventions about entry, contact and helping a fallen participant up. Silverberg and colleagues modelled collective motion at metal concerts and found that the disordered movement of a mosh pit and the rotational movement of a circle pit are statistically describable as collective states, comparable in their treatment to gases and vortices.24 That paper is physics, and it is cited here only for what it establishes: the crowd's motion is patterned rather than random. It says nothing about meaning, and no anthropological conclusion should be drawn from it.
Meaning is where the ethnographic work applies. Pérez Pelayo's study of the Mexican band Cemican analyses how symbolic performance, in that case pre-Hispanic imagery, language and ritual staging, generates communitas among an audience: a temporary condition of shared status and shared feeling produced by participating in a performance together.25 Attendance functions there as a form of collective symbolic practice, and its value to the participant is not fully substitutable by a recording. Ghost's staging works on similar mechanics in a commercial register, with a fixed mythology, costumed personnel, and a phone-free policy that removes the recording device from the room and returns the audience's attention to the event and to each other.12 The policy is a sourced fact about the tour; the interpretation of what it does to the room is an inference.
Battle Jackets, Vinyl and the Economics of Belonging
Metal's material culture has been documented in enough detail to describe how it works, and the documented practices are elaborate and long-lived; whether they are more durable than the material cultures of other scenes has not been measured comparatively. The battle jacket, a denim or leather vest carrying accumulated band patches, has its own scholarly literature; one study of metalhead identity treats the garment as a curated biographical object, assembled over years, read by other participants, and repaired rather than replaced.23 A jacket of that kind is a record of attendance. It encodes which shows the wearer went to and in what order, which makes it an artefact whose value increases with continued participation.
The measured behaviour lines up with the ethnography at one specific point. Luminate's finding that hard-rock listeners are 150 percent more likely than average to listen on vinyl describes a preference for a format that costs more, takes up space and cannot be consumed away from the equipment that plays it.5 The finding that they are 138 percent more likely to discover music through video games describes a discovery path running through another medium with its own communities and its own duration of engagement.5 Both behaviours are slower and more committing than the default streaming path, and both are consistent with an audience that accumulates rather than cycles. Neither is evidence about ticket buying, and Luminate does not present them as such.
For an operator, the practical consequence is that per-head revenue in these genres is not carried by the ticket alone. Merchandise in a scene where a shirt functions as a membership marker behaves differently from merchandise sold as a souvenir, and the difference should show up in per-capita spend at the venue. No public dataset reports merchandise per head by genre, so the claim stops at the level of a testable expectation.
From Clubs to Arenas
The strongest evidence against a purely nostalgic reading of the genre's live economy is the group of acts that reached arena scale recently. Pollstar reported that Sleep Token played 17 U.S. arena shows in 2025 averaging 12,117 tickets and roughly $1.4 million gross per show, with Barclays Center in Brooklyn selling 12,561 tickets for $1.79 million.7 Only a few years earlier the same act was playing rooms below 2,000 capacity. That progression, sub-2,000 to sold-out arenas without conventional radio support, was described by the tour's promoter in terms of superfandom and community: an audience that organises around the act's anonymity, masks and internal mythology, and that treats attendance as participation in something with rules.7 The promoter's characterisation is a trade-press quote and is treated here as testimony rather than measurement.
Ghost's Skeletour reached roughly half a million tickets by September 2025, with a sold-out Madison Square Garden at 12,527 tickets and $1,385,794, a sold-out European run, and multiple arena dates in the 10,000 to 14,000 range.12 Bring Me The Horizon's touring history traces the same slope over a longer period, from a UK hardcore and metalcore scene to global arena headlining, with a sound that has absorbed pop, electronic and hip-hop production without losing the audience it started with.14 Genre permeability of that kind complicates classification for anyone counting shows by genre, and it is one reason a genre-level concert census would be difficult to build even if someone tried.
These three acts each built an audience in small rooms first, retained it through changes in sound and presentation, and arrived at arena capacity with a body of shared reference the audience had helped construct. That is a description of these three careers and not a general route: other acts have reached arena scale through radio, festival slots, film and television placement, or a single crossover record, and nothing here says otherwise. The ticket counts at each stage are reported; the mechanism connecting them is inference.
Stadiums Built on Catalog
Above the arena tier, the genre's established acts hold stadium capacity on catalog. Pollstar reported that System of a Down sold out a six-date North American stadium run in 2025 and moved more than 500,000 tickets across a Latin American stadium tour, including 70,000 at Interlagos in São Paulo and 100,000 across two nights at Allianz Parque.8 The band has released no new studio album since 2005. Demand at that scale, two decades after the last record, is difficult to explain through release-cycle mechanics and easy to explain through an audience that maintained the relationship in the interval.
Deftones and System of a Down together drew 50,186 tickets and $9.6 million for a single Golden Gate Park event in 2024, an outdoor show at festival scale built from two catalog acts rather than a festival brand.9 Pantera's 2025 run covered 29 amphitheatre and arena dates with Amon Amarth in support, a reunion configuration selling at a tier well above what the constituent members were touring at individually.17 Slayer's career total in Pollstar's box-office database exceeds 1.7 million headline tickets and $89.5 million, a figure that spans decades of reporting and is included here as a measure of accumulated base rather than current demand.18
These cases have a survivorship problem that should be stated plainly. Acts that reached stadium scale are the ones that survived; the far larger population of metal acts that never got past clubs, or that broke up during the genre's low-visibility decades, generates no box-office reporting at all. Reasoning from the visible top of the distribution to the health of the whole category is exactly the error this publication tries to avoid, and the tables here are labelled as cases for that reason.
Metal Travels. Scenes Stay Local.
Metal is one of the most geographically distributed popular musics, and its local instances are not copies of an Anglo-American original. BABYMETAL, a Japanese act combining metal instrumentation with idol-pop performance conventions, sold out The Theater at Madison Square Garden in 2025 with 4,619 tickets and $334,694, and sold out The O2 in London at 15,000 in the same year.13 A venue-class spread of roughly three times inside one touring year is a fact about how differently a single act's audience is distributed across territories, and it is the kind of variation that averaged genre statistics erase.
Latin America's role in the numbers above rests on one reported case. System of a Down's largest single-territory ticket volumes in 2025 were South American, with 70,000 at Interlagos and 100,000 across two Allianz Parque nights.8 That is evidence about one act's touring year in Brazil, and no regional total by genre is published, so it does not establish the size of metal demand across Latin American markets generally. Pérez Pelayo's work on Cemican describes a Mexican scene in which metal performance carries indigenous symbolism and local historical reference, producing meanings specific to that context.25 The genre travels, and it changes on arrival; what the audience in São Paulo is participating in is not identical to what the audience in Syracuse is participating in, even when the act on stage is the same.
Passing the Patch Down
Luminate's 2025 finding that hard-rock listeners skew Millennial, combined with rock's high deep-catalog share, describes an audience with a long relationship to the material.25 The visible evidence at shows, families attending together, teenagers in the shirts of bands that broke up before they were born, is anecdotal in the strict sense and is treated as such here. Snell's dissertation research on metal identity and community documents entry into the scene as a socially mediated process, in which existing participants introduce new ones and transmit the knowledge and conduct that membership requires.26
If transmission works that way, the commercial implication is a demand curve with a long tail and slow decay, since each cohort of participants recruits some fraction of the next. Nothing in the published data measures recruitment. Age distribution by genre at the ticket level would settle it, and no promoter or ticketing company publishes it.
Where Metal Ends and Hardcore Begins
Knocked Loose is frequently absorbed into metal coverage, and the band is a hardcore act with its own scene lineage, venue circuit and conduct norms. Pollstar reported headline growth for the band alongside arena support slots on Slipknot's 25th-anniversary run, a progression that moves a hardcore audience into arena rooms without converting it into a metal audience.1516 The distinction matters for measurement: a genre census that assigns shows by lineup adjacency would count those dates as metal and would be wrong about what the room contained.
The same classification problem runs through the streaming figures. Luminate assigns each recording to a single genre, so rock's 137.2 billion streams include hard rock and metal without separating them, and exclude cross-genre listening that any individual fan does.1 Every quantitative claim in this piece about metal specifically rests either on Live Nation's own genre attribution or on act-level ticket counts, and neither is a national genre measurement.
How Far the Evidence Goes
The supported inference is this: metal and hard-rock demand may be unusually durable because listening, live attendance, identity, material culture and scene participation reinforce one another across release cycles, so that each activity raises the probability of the others continuing. The measured facts consistent with this are rock's stream volume and its rising deep-catalog share, hard-rock listeners' higher rates of vinyl listening and game-based discovery, one promoter's reported 14 percent growth in hard-rock and metal activity, and act-level ticket counts at theatre, arena and stadium scale for acts both new and decades old. The scholarly findings consistent with it describe scenes maintained through practice, boundary work, embodied ritual and symbolic performance.
What is missing is the join. No dataset links a person's scene participation to their ticket purchases, no independent source publishes concert volume or attendance by genre, and no promoter publishes per-head merchandise by genre or age distribution by show. The inference is a reading of several separately collected bodies of evidence, and it should be held with the confidence that supports.
The Missing Metal Census
A genre-level activity series would require an event census with consistent genre attribution: every ticketed show above a stated capacity, in a defined territory and window, with a published rule for how a show is assigned to a genre and a stated treatment for mixed bills. Lineups and listings make that collectable, and the classification problems described above make the rule harder to write than the collection is to run. Nobody publishes it, which is why the strongest available claims about metal's live economy remain a streaming statistic, a promoter's description of its own activity, and a list of individually reported shows.34
Research notes and limitations
Live-activity growth figures are reported by a single promoter about its own events and are not independent market measurement. Ticket counts and grosses are Pollstar's reporting of box-office submissions, which Live Index has not independently audited; venue classes, territories and reporting windows differ by row and no aggregate is derived from them. Streaming genre attribution follows Luminate's classification, which assigns each recording to one genre and therefore both understates cross-genre listening and prevents metal from being separated from rock in the national series. The scholarly sources cited describe scene participation in specific places and periods and were not designed to measure commercial demand; every step from those findings to a statement about ticket sales is labelled as inference in the text. Selection is a live risk throughout: acts appear here because their shows were reported, and acts whose shows were not reported are absent by construction.56
References
- 01Associated Press, reporting Luminate's year-end genre data: U.S. rock on-demand audio streams increased from 234.22 billion in 2024 to 260.5 billion in 2025. Luminate, Midyear Music and Film/TV Industry Report 2026, source of 137.2 billion U.S. on-demand audio streams for rock and 732.7 billion total U.S. on-demand audio streams in the first half of 2026. The 18.7 percent share is calculated by Live Index from those published totals. apnews.com/article/a5e06a001705cd7e5d3854d8fab901b8 · luminatedata.com/reports/midyear-music-ftv-report-2026
- 02Luminate, Midyear Music and Film/TV Industry Report 2026, reporting rock's 75 percent deep-catalog share and increase of five percentage points year over year. luminatedata.com/reports/midyear-music-ftv-report-2026
- 03Live Nation Entertainment, Bad Omens arena-tour announcement, reporting a 14 percent increase in hard-rock and heavy-metal live activity and approximately 13 percent of its arena and stadium shows. Company-reported. newsroom.livenation.com/news/bad-omens-announce-north-american-arena-headline-tour-with-openers-beartooth-president
- 04Luminate, Live Music 2026, on live-music attendance behaviour and fan spending in the United States. luminatedata.com/reports/live-music-2026
- 05Luminate, analysis of fan growth in R&B, hard rock and Christian music in 2025, reporting that hard-rock listeners skew male and Millennial, are 138 percent more likely to discover music through video games and 150 percent more likely to listen on vinyl. luminatedata.com/blog/what-rb-hard-rock-and-christian-music-tell-us-about-fan-growth-in-2025
- 06Live Nation Entertainment, Form 10-K for the fiscal year ended 31 December 2025, reporting approximately 55,000 events promoted and approximately 159 million fans — the denominator any promoter-reported genre share sits inside. www.sec.gov/cgi-bin/browse-edgar?action=getcompany&CIK=0001335258&type=10-K
- 07Pollstar, on Sleep Token's 2025 arena tour: 17 U.S. arena shows averaging 12,117 tickets and about $1.4 million gross per show, including 12,561 tickets and $1.79 million at Barclays Center, with the promoter's description of the act's superfandom and community. news.pollstar.com/2025/10/24/the-stuff-of-lore-sleep-token-hit-another-level-with-no-1-album-massive-arena-tour-masks
- 08Pollstar, on System of a Down's 2026 European stadium dates, reporting a sold-out six-date North American stadium run in 2025 and more than 500,000 tickets on the Latin American stadium tour, including 70,000 at Interlagos and 100,000 across two nights at Allianz Parque. news.pollstar.com/2025/09/10/system-of-a-down-announces-2026-european-stadium-dates
- 09Pollstar, on Deftones' 2025 North American dates, reporting 50,186 tickets and $9.6 million for the Deftones and System of a Down Golden Gate Park event in 2024. news.pollstar.com/2025/03/13/deftones-add-14-north-american-dates-to-2025-tour
- 10Pollstar, Top Tour report of 23 May 2025: Metallica's M72 tour past $340 million grossed and 2.9 million tickets across 49 stadium concerts, including 137,620 tickets and $15.2 million across three Syracuse and Toronto shows. news.pollstar.com/2025/05/23/this-weeks-top-tour-metallica-claims-top-live75-ranking-after-resuming-m72-tour
- 11Pollstar, on Metallica's 2026 Sphere Las Vegas residency. news.pollstar.com/2026/02/25/metallica-enters-sphere-las-vegas-with-life-burns-faster
- 12Pollstar, on Ghost's Skeletour: approximately half a million tickets by September 2025, a sold-out Madison Square Garden at 12,527 tickets and $1,385,794, a sold-out European run, multiple arena dates in the 10,000–14,000 range, and the tour's phone-free policy. news.pollstar.com/2025/09/30/ghost-add-north-american-dates-to-skeletour-world-tour-2026
- 13Pollstar, on BABYMETAL's CAA signing, reporting a sold-out 2025 show at The Theater at Madison Square Garden with 4,619 tickets and $334,694 and a sold-out O2 London at 15,000. news.pollstar.com/2025/07/22/japanese-rock-band-babymetal-signs-with-caa-exclusive
- 14Pollstar cover story on Bring Me The Horizon's global touring, on the band's progression from a UK scene circuit to arena headlining and its movement across genre boundaries. news.pollstar.com/2024/12/10/a-family-affair-bring-me-the-horizon-conquers-global-touring-cover-story
- 15Pollstar, on Knocked Loose's headline touring growth. The band is a hardcore act and is distinguished from metal throughout this piece. news.pollstar.com/2024/08/14/knocked-loose-embarking-on-fall-tour-to-promote-latest-album
- 16Pollstar, on Slipknot's 25th-anniversary U.S. arena dates, the run on which Knocked Loose appeared in support. news.pollstar.com/2024/04/30/slipknot-announces-u-s-dates-for-25th-anniversary-here-comes-the-pain-tour
- 17Pollstar, on Pantera's 29-date 2025 U.S. summer amphitheatre and arena tour with Amon Amarth. news.pollstar.com/2025/02/24/pantera-announces-u-s-summer-tour
- 18Pollstar, reporting Slayer's career box-office database total of more than 1.7 million headline tickets and $89.5 million. news.pollstar.com/2025/08/27/slayer-heads-to-hersheypark-in-september
- 19Deena Weinstein, Heavy Metal: The Music and Its Culture, on the genre's audience, institutions and codes of conduct. www.hachettebookgroup.com/titles/deena-weinstein/heavy-metal/9780306809705
- 20Keith Kahn-Harris, Extreme Metal: Music and Culture on the Edge, on scene infrastructure, boundary maintenance and internal political conflict in extreme metal. kahn-harris.org/book/extreme-metal-music-and-culture-on-the-edge
- 21Susanna Larsson, 'I Bang my Head, Therefore I Am': constructing individual and social authenticity in the heavy metal subculture, Young, on embodied practice and identity claims among Swedish metal fans. journals.sagepub.com/doi/10.1177/1103308812467673
- 22Dave Snell and Darrin Hodgetts, Heavy metal, identity and the social negotiation of a community of practice, on participation, recognition and shared activity within a metal scene. researchcommons.waikato.ac.nz/items/4a77098e-0ab0-4ed7-a824-57067d5f2f43
- 23'My Musical Armor: Exploring Metalhead Identity through the Battle Jacket', on the accumulated patch vest as a curated biographical object read by other participants. www.tandfonline.com/doi/full/10.1080/19401159.2021.1872763
- 24Jesse L. Silverberg and colleagues, Collective Motion of Moshers at Heavy Metal Concerts, on the statistical description of disordered and rotational crowd motion. Cited only for the physics of collective movement. arxiv.org/abs/1302.1886
- 25Pérez Pelayo, 'Building communitas through symbolic performances: Mexican metal and the case of Cemican', Metal Music Studies, on symbolic performance and communitas in a Mexican metal audience. intellectdiscover.com/content/journals/10.1386/mms_00038_1
- 26Dave Snell, doctoral research on metal identity and community, on entry into a scene as a socially mediated process. researchcommons.waikato.ac.nz/items/8c8dc1a6-a116-4379-ae32-5ba2d7735cc6
Publication record
The structured record for this document. Classification is drawn from the Live Index controlled vocabulary so relationships between people, subjects, places and measurements stay consistent across the platform.
- Content type
- Analysis
- Primary topic
- Live Music Economics
- Secondary topics
- Artist EconomicsFestival EconomicsVenue Economics
- Themes
- Market HealthFan AlignmentParticipation
- Economic concepts
- DemandPrice ElasticityConsumer Surplus
- Measurements
- Concert Activity Index
- Methodology
- What we measure
Corrections and revisions
No corrections have been issued for this document. Substantive errors are corrected on this page, dated and retained.
Cite this research
- Plain
- Omar Afra, "Metal’s Quiet Bull Market", Live Index, August 15, 2026 (updated August 17, 2026), https://liveindex.io/research/metal-quiet-bull-market
- APA
- Afra, O. (2026, August 15). Metal’s Quiet Bull Market. Live Index. https://liveindex.io/research/metal-quiet-bull-market
- Chicago
- Omar Afra. "Metal’s Quiet Bull Market." Live Index, August 15, 2026. https://liveindex.io/research/metal-quiet-bull-market.
- BibTeX
- @online{research-metal-quiet-bull-market-2026, author = {Omar Afra}, title = {Metal’s Quiet Bull Market}, organization = {Live Index}, date = {2026-08-15}, urldate = {2026-08-17}, url = {https://liveindex.io/research/metal-quiet-bull-market} }