Research
The Venue Ladder
A city's live-music capacity is not adequately described by the number of venues it contains. Artist development depends on a sequence of economically viable rooms at different scales, and missing rungs can constrain local growth.
- Authors
- Published
- Updated
Conceptual framework · not measured data
The sequence of rooms an artist needs a city to contain
The article argues that capacity is a sequence, not a count. Each rung must be economically viable for the next to be reachable; the bars encode the article's claim about where a missing rung most constrains local development, not observed data.
First stage
smallest rooms and back rooms
Lower margin pressure
Where a first audience is assembled at almost no cost to anyone.
Club
roughly 200–600 capacity
Moderate
The first room where a draw can be tested against real costs.
Theatre
roughly 1,000–3,000 capacity
Highest margin pressure
The rung the article identifies as most often missing, and hardest to replace.
Arena
10,000 capacity and above
Lower margin pressure
Reachable only for artists who have already cleared the rungs below it.
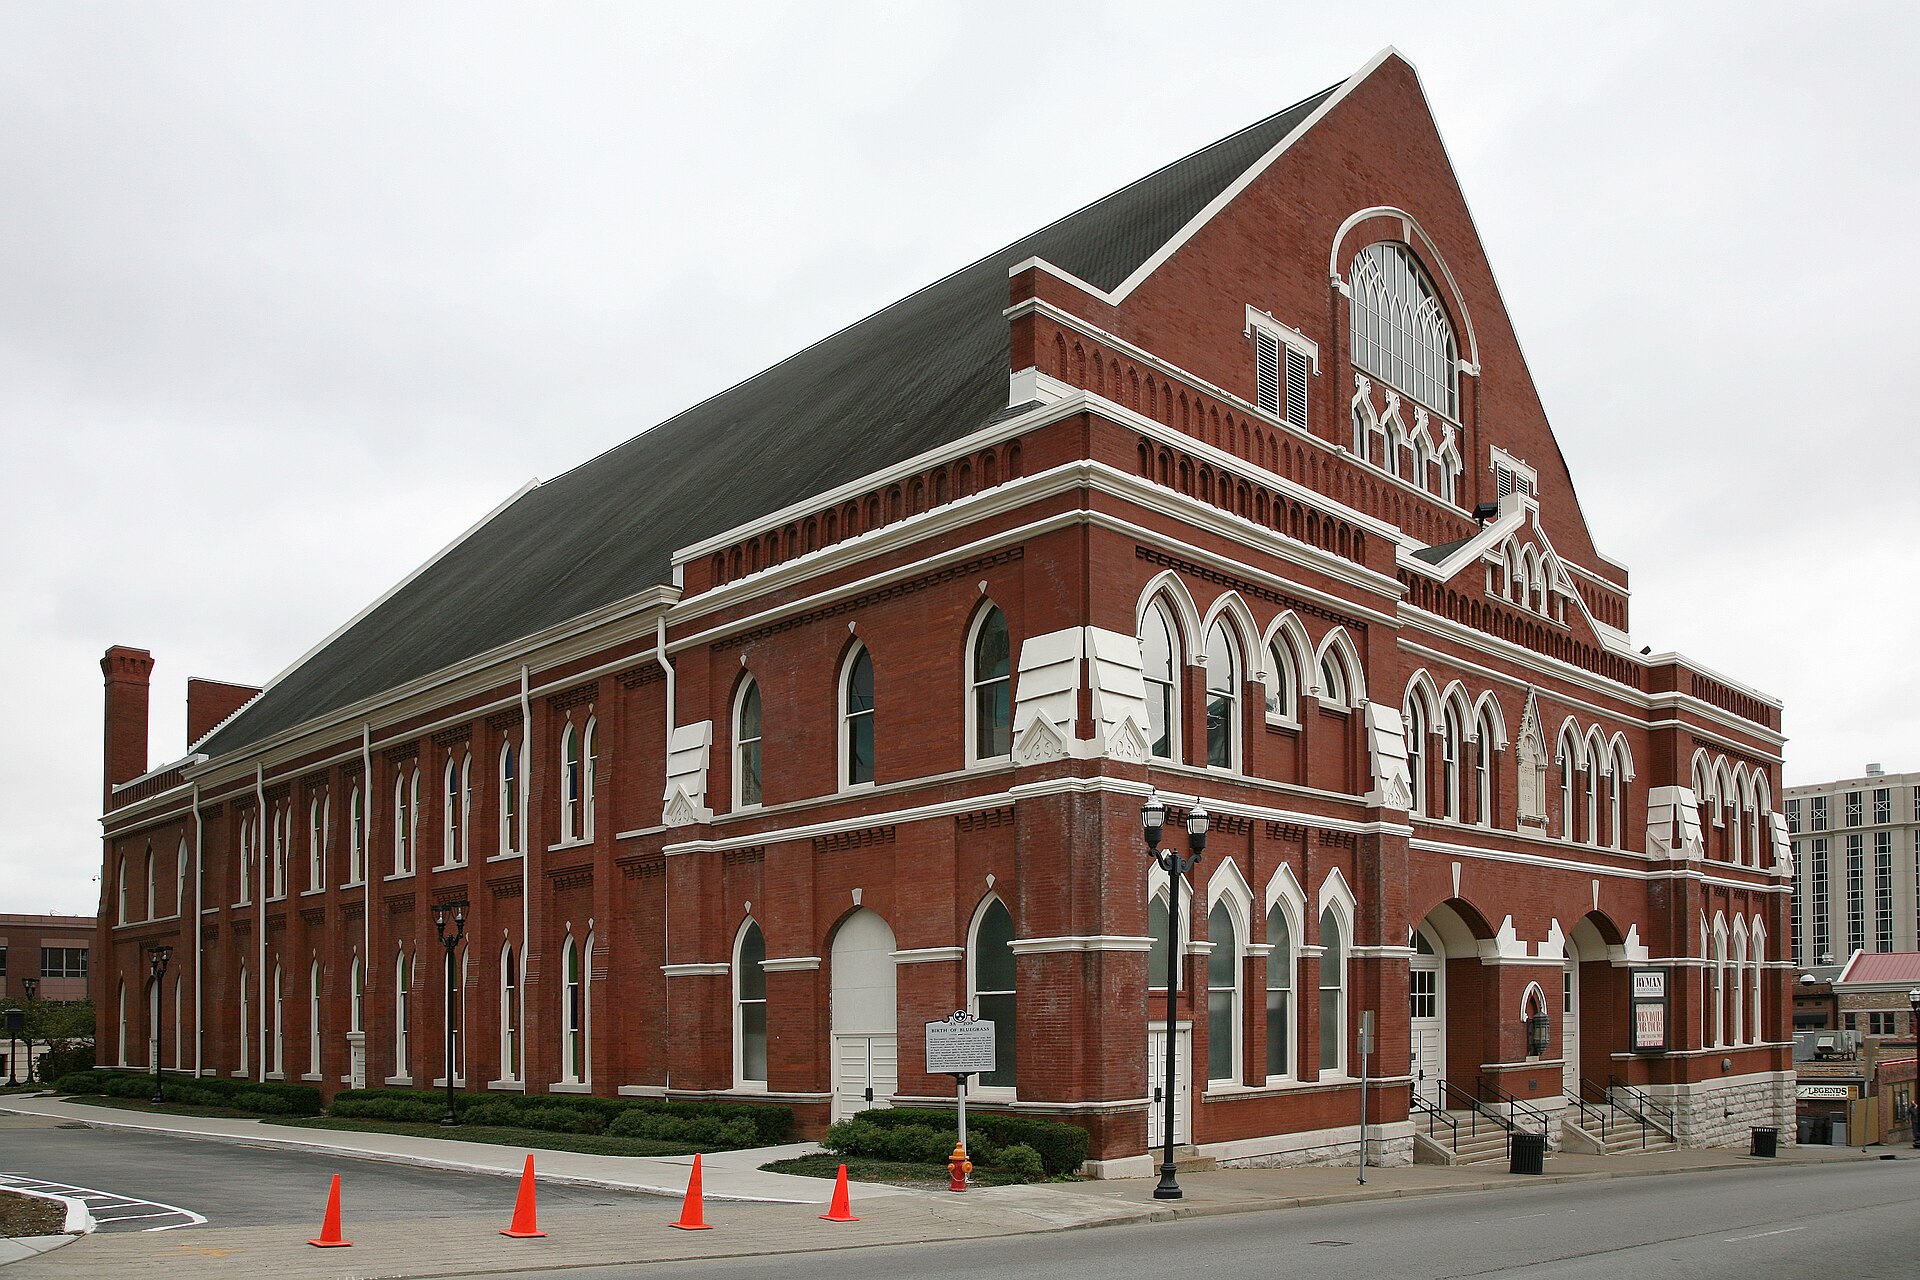

Venue count is a weak measure of live-music infrastructure because it treats rooms of radically different scale as interchangeable. A city with fifty 150-capacity bars and one arena may report fifty-one venues, yet an artist capable of selling 800 tickets has no obvious place to perform. The economically relevant object is therefore not the count but the capacity distribution: whether a market provides a plausible sequence of rooms through which artists can grow.
The progression is rarely perfectly linear, but a stylized ladder might include rooms around 150, 300, 500, 800, 1,200, 2,000, 3,500, 5,000, 10,000 and arena scale. Each step changes the economics of production. Stage dimensions, labor requirements, security, ticketing, hospitality and technical systems become more complex. An artist who can reliably sell 400 tickets may not be ready for a 1,500-capacity theater, even if that is the next available professional room.
This creates a supply constraint that can be invisible in aggregate attendance statistics. Major touring acts can still play the arena. Local bands can still perform in bars. The missing middle affects the process by which a local or regional act converts audience growth into a larger event without taking a disproportionate financial risk. Promoters face the same discontinuity: moving from a 500-capacity room to a 2,000-capacity room can multiply guarantee, production and marketing exposure before demand has multiplied at the same rate.
The National Independent Venue Association's 2025 research shows why the availability of intermediate rooms cannot be assumed. Sixty-four percent of independent stages were not profitable in 2024 and 22 percent reported struggling to stay in business.1 Those figures do not isolate venue capacity, but they suggest that the layer most likely to supply artist-development rooms is financially vulnerable.
A Venue Supply Index should therefore catalog usable capacity, not nominal capacity alone. A 1,000-person room that rarely presents music, has a prohibitive rental structure or lacks suitable production should not be treated as equivalent to an active 1,000-person concert venue. Similarly, a venue closed for renovation or tied to programming that excludes most touring acts should be coded differently from open market supply.
Utilization also matters. A market with three theaters at 2,000 capacity may still have a shortage if those rooms are booked heavily by Broadway, comedy or private events. The relevant measure is available concert dates at a given scale. Conversely, a market can contain many nominal venues while demand is insufficient to support them all. Supply should be interpreted with booking volume and sell-through.
The ladder is geographic as well as numerical. A 1,500-capacity venue located far from the neighborhoods in which a scene develops may have different demand characteristics from a similarly sized room near transit and nightlife. Venue placement affects transportation cost, pre- and post-show spending and audience willingness to attend on weeknights. Capacity analysis should therefore be integrated with spatial analysis rather than presented as a simple histogram.
The concept also clarifies why venue closures can have nonlinear effects. Losing one 300-capacity bar in a city with twenty similar rooms may be inconvenient but not structurally decisive. Losing the only 1,200-capacity independent room can remove an entire rung. Artists are then forced either to repeat smaller rooms, skip the market, use a less suitable facility or take the financial risk of jumping to a much larger venue.
A city-level Venue Ladder should record at least the venue name, usable concert capacity, configuration range, ownership, booking model, ticketing arrangement, active-show count and geographic coordinates. Over time, opening and closure data can show whether capacity is migrating toward particular sizes or ownership types. This would allow Live Index to identify "capacity deserts" with more precision than anecdotal claims about a city's scene.
Artist-routing data could test whether the ladder actually matters. If artists of a particular draw routinely skip markets that lack appropriate rooms, that is evidence of a supply constraint. If artists simply use alternative facilities without attendance loss, the missing rung may be less important than assumed. The value of the framework is that it produces testable propositions.
Venue policy frequently focuses on preserving individual institutions. The ladder adds a system-level perspective. A city might decide that replacing a closed 1,500-capacity room is more urgent than adding another 200-capacity bar because the former fills a unique development function. Private investors can use the same analysis to identify underserved capacity bands.
The long-term health of a music market depends partly on whether artists can progress without leaving it. A stadium is evidence that a city can host global demand. A complete venue ladder is evidence that the city can help produce demand of its own.
Research notes and limitations
There is no universal set of capacity bands appropriate to every market. Venue configurations change by event, and usable concert capacity can differ from fire-code maximum. The suggested ladder is a research framework that should be calibrated to local markets and booking behavior.
References
- 01National Independent Venue Association, State of Live Economic Research Study, 2025. www.nivassoc.org/stateoflive
Publication record
The structured record for this document. Classification is drawn from the Live Index controlled vocabulary so relationships between people, subjects, places and measurements stay consistent across the platform.
- Content type
- Data Brief
- Primary topic
- Venues
- Secondary topics
- Venue EconomicsArtist Economics
- Themes
- Market Health
- Economic concepts
- Fixed CostsSupply ConstraintsDemand
- Measurements
- Live IndexVenue Supply Index
- Methodology
- What we measure
Corrections and revisions
No corrections have been issued for this document. Substantive errors are corrected on this page, dated and retained.
Cite this research
- Plain
- Omar Afra, "The Venue Ladder", Live Index, August 13, 2026, https://liveindex.io/research/venue-ladder
- APA
- Afra, O. (2026, August 13). The Venue Ladder. Live Index. https://liveindex.io/research/venue-ladder
- Chicago
- Omar Afra. "The Venue Ladder." Live Index, August 13, 2026. https://liveindex.io/research/venue-ladder.
- BibTeX
- @online{research-venue-ladder-2026, author = {Omar Afra}, title = {The Venue Ladder}, organization = {Live Index}, date = {2026-08-13}, url = {https://liveindex.io/research/venue-ladder} }